
These days, there is very little reporting on Covid levels in our area. The weekly reports from Resident Care stopped once the cases had subsided. But from time to time we residents still learn of resident cases through the grapevine, and sometimes we wonder if they reflect a resurgence of cases in our area. Is it time to think about wearing a mask in the grocery store? Are sporting events and concerts a potential problem?
There isn’t much Covid testing of the general public anymore, so data on actual cases is hard to come by. But there is an alternative source of data: wastewater testing.
Residents who have been here since the beginning of the pandemic will remember how KCC was one of the pioneers in this area in doing wastewater testing. It may well be that we were the first retirement community anywhere to try it. I published a blog post about how we did it and another one showing that it really did work, even down to the level of detecting a single case on the Crosslands campus. But it was too expensive and the turnaround time was too slow to be of significant benefit in controlling Covid at KCC, and the program was dropped after a few months.
However, since then Chester County has set up a surveillance program monitoring two waste treatment sites in our area, and there is also monitoring in neighboring Delaware County.
How it works. Wastewater surveillance is based on determining the number of copies of the viral RNA in the wastewater. (RNA is the genetic material of the Covid virus.) The number of copies of the RNA per liter of wastewater is measured in a laboratory. That number is compared to the number of people served by the wastewater treatment plant and the volume of waste it handles, to derive the number of viral copies per resident (reported as “Viral Load per Population Served” or VL/PS).
The chart below represents the current data (as of July 10, 2024) at the treatment plant nearest Kendal. You can see that the VL/PS is currently very low (between 0.1 and 0.5 in June and early July). It has spiked up over 10 twice so far in 2024, and it went as high as 30 in early 2023.
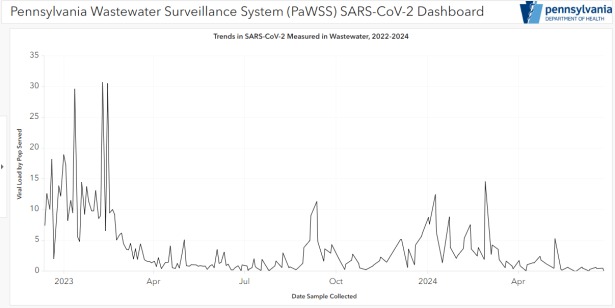
Interpreting the data. Unfortunately, the number of actual Covid cases can’t be derived from the VL/PS measurement because there are too many other variables involved. For example, the amount of virus shed by a person varies with the course of the disease, and the wastewater may be diluted if stormwater enters the sanitary sewers. That means the viral load data is more useful as an indicator of trend than as a means of counting cases. Still, it is evident from the charts that VL/PS lower than 10 is good, and a count lower than 1 (which is what we are currently experiencing) means there is almost no Covid around.
In the future, you can use the link given in the caption above to see whether the Covid situation has changed.

Greetings from Collington (a Kendal affiliate). Appreciate your blog.
Collington took very good care of us back in the day, including weekly publication of our covid dashboard. That has long since ceased. But covid is still out there, and unfortunately many of us living in this protected bubble seem to think that it really is “out there” in the community maybe, but not “here” on campus, and we are increasingly careless about precautions. Thus we have had at least one outbreak with 20 or more cases this year and likely more, since the Administration has not been reporting it and the custom of posting on the resident listserve when one tested positive for covid had fallen out of use. I begged our COO to resume publishing weekly counts of infections to make residents aware that covid was lurking here at home, up close and personal, and was told “we no longer utilize COVID dashboards as they only depict a moment in time.” I wrote back “Reminders on what to do, handwashing, mask wearing, etc. are all well and good, but ever so easy to ignore if one thinks covid is somewhere else, not on campus. A dashboard is a moment in time and we need to be informed, at this moment in time, ifthere is one case of covid on campus, 2 cases, or a dozen. We needed to know that last week and we will need to know it next week. Please reconsider furnishing us with that information on a routine basis.” Of course, nothing continues to be reported. Last week a resident posted ont he listserve that she is recovering from norovirus. How’s that for scary. And we hear nothing from our administration.
Lorrie Rogers
LikeLike