
This is a guest post by Crosslands resident Allen Prindle. Just as he did for 2023, Allen has compiled a carbon footprint for Kendal-Crosslands for the year 2024, based on utility records. As you will see, there is good news and bad news. Our carbon footprint was lower in 2024 than in 2023, which is obviously a good thing. But we can’t take credit: the drop was due primarily to less fossil fuel use by the generating plants that supply our electricity.
The purpose of this Carbon Footprint Study Report is to calculate the CO2 emissions for Kendal-Crosslands Community (KCC), and to compare it to previous years to learn how much progress has been made toward a climate change goal. In 2024, I did a Carbon Footprint Study for 2023 that was compared to a previous 2019 study. (Prindle, 2024) This report is designed to use the same design to allow easy comparisons.
I obtained access to invoices for various energy sources for the 2024 calendar year. The amount of each energy source was added together to get a total for the year. Then the metric tons of CO2 emissions were calculated based on the total used by KCC. The results for 2024 are shown in Table 1.
Table 1: 2024 CO2 Emissions for KCC
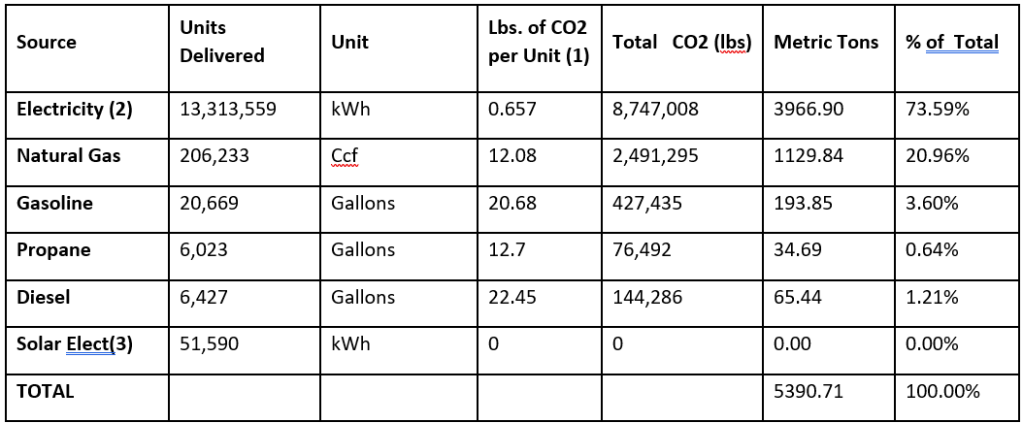
(1) Source U.S. Energy Information Administration, eGRID
(2) Includes 7,144,900 kWh at KAL, 6,964,979 kWh at XL, and 103,680 at Worth Bldg.
(3) Includes 50,230 kWh at Crosslands, 1,360 kWh at KAL Lot 10B
The data in Table 1 show that there were over 5,300 metric tons of CO2 emissions in 2024. About 74% of the CO2 emissions were from electricity, and about 21% were from natural gas. The remaining 5% were from three other sources, and are shown in Table 1.
KCC used 13.3 million kWh of electricity. According to eGRID, there was 0.657 pounds of CO2/kWh from the local grid electricity. Then the calculations in the table show 3,967 metric tons of CO2 emissions were generated from electricity at KCC. This amount is about 74% of the total CO2 emissions for 2024. The CO2 emissions for Crosslands and for KAL were about the same in 2024.
The grid is less polluting in recent years, as measured by pounds of CO2/kWh. In 2023 the ratio was 0.711, and for 2024 it was 0.657. This was a decrease of about 7.5 percent. This is a result of the grid using less coal and other highly polluting fuels. While KCC used about 2 percent more electricity in 2024 than in 2023, the net result was about 6 percent decrease in CO2 emissions from electricity from the grid.
Solar electricity entered the energy supply in 2023 with 108 solar panels installed at Crosslands. In July, 2024, an array with 12 solar panels went into production at KAL, Lot 10B. The data in Table 1 shows the solar electricity production from the two sources. There are no CO2 emissions from solar energy. The solar energy production means that KCC purchased less electricity from the grid, and had less CO2 emissions.
The CO2 emissions from other energy sources are also shown in Table 1 for natural gas, gasoline, propane and diesel uses by KCC. About 21% of the total emissions were from natural gas. About 5% of the KCC emissions were from the other sources.
Data in Table 2 show changes in use of energy from various sources in 2024, compared to 2023.
Table 2: Changes in KCC Energy Use, 2024 versus 2023
| Source | Units Delivered 2023 | Units Delivered 2024 | Unit | Percent Change |
| CO2 Emissions | 5590.22 | 5390.71 | Metric tons | -3.66% |
| Electricity | 13,062,306 | 13,313,559 | kWh | 1.92% |
| Natural Gas | 202,916 | 206,233 | Ccf | 1.63% |
| Gasoline | 24,128 | 20,669 | Gallons | -14.34% |
| Propane | 4,499 | 6,023 | Gallons | 33.87% |
| Diesel | 2,406 | 6,427 | Gallons | 167.12% |
| Solar Elect | 9,190 | 51,590 | kWh | 461.37% |
| KAL Elect | 6,898,213 | 7,144,900 | kWh | 3.58% |
| Crosslands Elect | 6,072,253 | 6,964,979 | kWh | 14.70% |
| Worth Elect | 91,840 | 103,680 | kWh | 12.89% |
Electricity use for KCC increased by about 1.9% between 2023 and 2024. As indicated above, about 74% of the CO2 emissions at KCC are from electricity use. The data in Table 2 also show a 1.9% increase in kWh use for KCC. This includes a 14.7% increase in electricity use at Crosslands, a 3.5% increase at KAL, and a 12.8% increase at Worth. This is a result of more electric devices in use by residents, staff and administration, including EV charging. The Energy Committees at Crosslands and at KAL work toward energy efficiency. NOAA indicated that the summer of 2024 was the fourth hottest summer on record.
Natural gas is used at KCC for heat in the community centers, for heating the swimming pools, for the kitchens, and for the laundry. The CO2 emissions from natural gas make up about 21% of KCC emissions. There was a 1.6% increase in natural gas use from 2023 to 2024. The CO2 emissions from natural gas use increased by 1.5% from 2023 to 2024.
Gasoline is used in the KCC vehicles and lawn equipment. Gasoline use decreased between 2023 and 2024 by about 14.3%. There may be many reasons for this decrease.
Propane is used at KCC for the maintenance building heat, and for outdoor events. CO2 emissions from propane and diesel make up a small percent of KCC emissions. The data in Table 2 shows propane use increased by about 34% from 2023 to 2024.
Diesel fuel is used for KCC vehicles and for the emergency generators. Diesel use increased by 167% from 2023 to 2024. During 2024, there were at least 5 days with no solar production (in January and July) and it was likely the generators were in use then.
In conclusion, there was a decrease of more than 3.5% in CO2 emissions by KCC between 2023 and 2024. Because more than 74% of the CO2 emissions are from electricity from the grid, the cleaner grid electricity is the driving force to achieve the lower CO2 emissions. The increased use of electricity, and most other energy sources was offset by the cleaner grid electricity. There are many opportunities to reduce KCC’s use of electricity and other energy sources in the future. The trend toward lower CO2 emissions is a good trend.
Allen Prindle, Crosslands Resident, June 2025
