
Some of the questions around “revitalization” at Kendal and Crosslands have centered on our housing units and our resident population. How many housing units is enough? What’s our optimum population?
There are a few clear limits: for example, our actuaries require us to have a certain number of nursing beds for each 100 residents. Since we aren’t planning to add nursing beds, that sets an upper limit on our resident population. But there aren’t many of those clear answers, and so we are often left with just our opinions and our instincts.
One place we can look for some guidance, however, is our history. I recently received from Kendal resident Merritt Cleaver a treasure trove of historical data about our population and our housing units. The data tells an interesting story that helps to explain some aspects of where we are today. Merritt’s data provides clues to why Crosslands is currently far below its historical maximum of residents, whereas Kendal is close to exceeding it, among other interesting insights.
I will focus on the period from around 1990 to today. (It would be interesting to look at the effects of the housing market collapse of 1980, which must have prevented many in the pool of potential residents from selling their houses, but the data doesn’t go back that far.)
The early peak. Both Kendal and Crosslands experienced a short-term peak in total population (independent living + personal care + nursing) around 1990. Kendal’s peak (about 382 residents) came in 1988. Crosslands’ peak (394 residents) came in 1994. (Except where I specifically mention “independent living”, I’ll only be talking about total population in this post.)
I hypothesize that these population peaks represent a recovery of full occupancy after the housing problems of the 1980s. I don’t believe there was a change in the number of housing units during that period (226 units at Kendal and 250 at Crosslands). If the number of units didn’t change, changes in occupancy rate must account for most of the resident population growth.
The 1990s. Between 1990 and 2000, there was almost no change in the number of units on either campus. Crosslands’ population also stayed relatively constant during that period, ranging between 384 and 394. However, Kendal’s population declined by 26, from 366 to 340, a decline of 7%.
The population losses at Kendal during the 1990s were mostly among women. Looking at the change for female Kendal residents only (they provided records by gender back then), we can see that Kendal lost a net of 22 women in that period. Why so many women? My hypothesis is that some of these women were among the last survivors of the original cohort of residents. A woman arriving in 1973 at age 70 might well have lived about 20 more years and died in the 1990s. Her husband (presumably a bit older, and with a shorter life expectancy) might have died in the 1980s.
The 2000s. The 2000s brought big changes to the Crosslands campus. A batch of 40 new duplexes (the “400s”) opened in 2004, and the population jumped from 380 in 2003 to 464 in 2004. In 2005, it hit 468, Crosslands’ highest-ever population. The following year, however, it dropped back to 421 and stayed around that level for the next five years. This seems like a very large drop (47 people in one year), and I can’t think of an explanation for it—perhaps a current resident who was at Crosslands during the 2000s can suggest the reason.
At Kendal, meanwhile, the population was basically stable during the first half of the 2000s, and it began dropping off during the period from 2006 to 2010. That was due, at least in part, to a process that was initiated then and is still continuing: combining neighboring small cottages to make larger ones. That process gradually resulted in a decrease in both the number of units and the resident population.
It’s likely that the 2008 financial crisis depressed occupancy rates in the late 2000s, further decreasing populations at both campuses, but I don’t know for sure because I don’t have occupancy data.
A chart showing the resident population from 2000 to the present is below.

The 2010s. During the 2010s, it was Kendal’s turn to grow. The new duplexes opened in 2012, adding 48 units, and the population jumped from 308 in 2012 to 423 in 2014. 423 remains the all-time peak for Kendal.
Kendal’s resident population has stayed mostly between 390 and 420 since the new duplexes were built. Interestingly, the independent-living portion of the population has increased a bit during that period, from 316 when the new duplexes opened to 325 in 2020.
In the 2010s, consolidation was well underway on both campuses. At Crosslands, it was mainly small apartments in the apartment buildings that were being combined. Over the last five years or so, apartments in Woolman were not put on the market when they were vacated (in anticipation of the demolition and replacement of the building). That added to the population drop. Crosslands’ population reached a low of 364 in 2014, its lowest ever since at least 1982 (the farthest back my data goes). Since 2014, it has been mostly in the 370s and 380s.
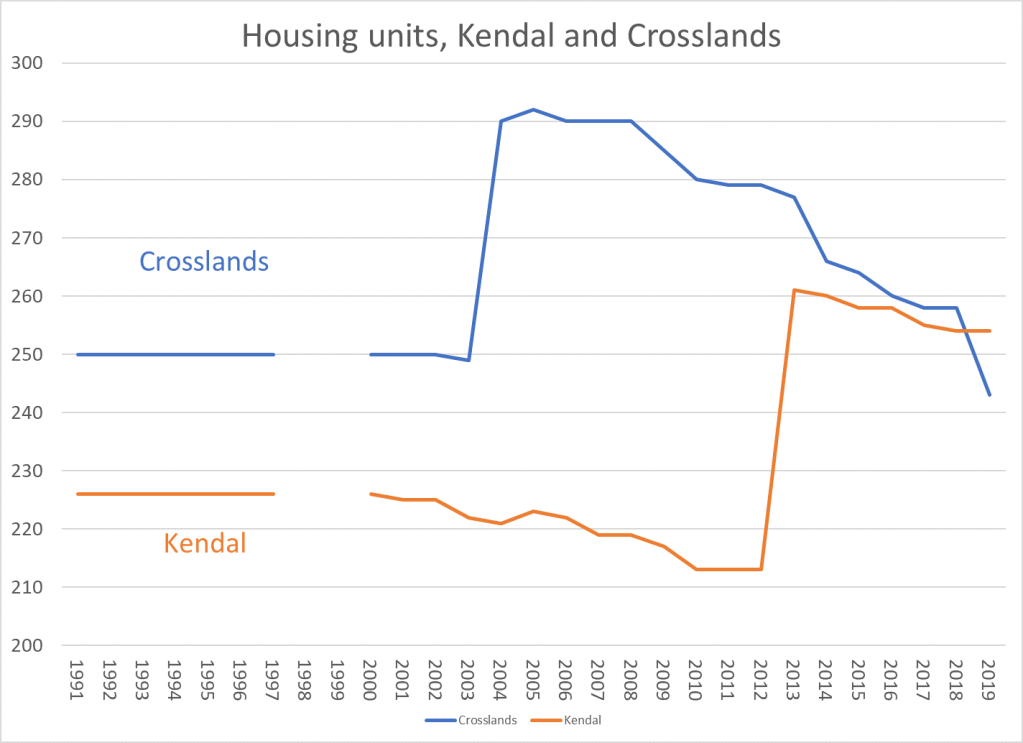
The number of housing units at Crosslands, having declined slowly for years, declined precipitously with the Woolman closure. By 2019, it was down to 243 units, the lowest ever.
The chart below tells the housing-unit story: an early period of little change, then a sudden increase at Crosslands (the 400s) and a sudden increase at Kendal (the new duplexes). And throughout the period from 2000 onwards, a steady loss of existing units on both campuses to consolidation.
The future. We know that the Mott and Woolman projects at Crosslands will add back 18 of the lost units there, and we can expect that close to 36 new residents will move into them. As revitalization takes shape, we can anticipate significant numbers of additional units and residents at Crosslands. Crosslands is currently almost 50 units and 80 residents short of its peak.
For Kendal, the future seems hazier. Kendal never experienced quite the extent of boom-and-bust of population and housing units that Crosslands did because of the difference in timing. By the time Kendal’s new duplexes were built, much of the Kendal consolidation process and associated population decline had already taken place. There has been relatively little consolidation since, compared with the large amount that Crosslands experienced following the building of the 400s.
As a result, Kendal’s total current population is within 10 residents of its peak, and the number of independent-living residents is right at the peak.
The revitalization planning has appeared to assume that Kendal’s population would be growing, just as it will at Crosslands. But does that make sense? The dining room and auditorium already seem undersized for the number of people who sometimes want to use them.
We should soon be hearing from the architectural team about the possibilities for both campuses, and that should make things a bit clearer.

Thanks, George. Although I have seen Merritt’s data, your writing and graphs have helped me make sense of the data. Grateful.
LikeLike
Glad you found it useful, Betty.
LikeLike