
Our local level of new Covid infections is low (although not yet quite as low as last July) and relatively steady. The signs are good.
The New York Times (as of 2/13/22) shows new cases in Chester County averaging 35 new cases daily per 100,000 residents, and the last few days have been even lower than that average. Neighboring Delaware County is also at 35, and New Castle County, Delaware, is at 34. The US national average is 54 per 100,000 and falling.
Last summer, there were several weeks in late June and early July during which the Chester County rates were below 10 per 100,000, so we are still higher than that, but not by a lot. By contrast, as recently as January, our county’s rate was over 200 per 100,000.
Still over 10% positivity. Why? One figure that remains relatively high is the county’s “positivity rate”, which is a measure of the percentage of all PCR tests that are positive for Covid. In Friday’s weekly report, the positivity rate was 10.42%, which the PA Department of Health considers “high”.
But that figure of 10+% needs to be viewed in the context of the overall pattern of disease and testing. Increasingly, people are self-testing with inexpensive test kits. The results of those tests are not reported to the county, and many of the people who test negative don’t bother to go and get a PCR test.
On the other hand, if you got really sick (and especially if you sought medical care) you would likely get a PCR test, and the result would be reported to the county. Those results would include a high proportion of people with actual Covid infections. I think it is possible that most of the PCR test results the county receives now are coming from hospitals and nursing facilities—settings in which PCR testing is routine and the people being tested are more likely to be sick. If that is true, of course you’ll get more positive tests than you would in testing a broader population.
Surprise! We seniors are healthier than usual this year. Most of the population was sicker than usual between mid-December and mid-January (as measured by incidence of fever), due to Omicron. Those over 65 were not.
This is the finding of Kinsa, a company that makes web-enabled thermometers that report temperature data to the company (anonymously). At this time of year, flu typically causes relatively high incidence of fever. One would expect Omicron to increase fever frequency further, and that’s what happened in younger people. For example, here’s the chart for the 45-64-year-old group, showing this season peaking far above normal levels.

On the other hand, among the 65+ crowd, fever incidence never made it up to the typical level for this time of year. Here is that chart.
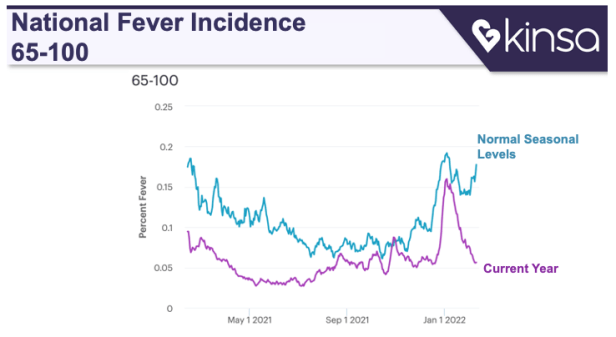
Kinsa believes this improved outcome for seniors is because their high vaccination rates have protected them from Covid. At the peak, senior rates of Covid infection were less than half the rates for people in their 30s, based on CDC data. And measures such as masking and social distancing have reduced flu incidence below normal levels.
To see the comparison of Covid rates over time, by age, gender, and region, you can visit a CDC page with interesting interactive graphics.

Thank you once again, George. Gratefully, Sally Palmer
On Sun, Feb 13, 2022 at 9:31 PM On the Kendal Journey wrote:
> galex49 posted: ” Our local level of new Covid infections is low (although > not yet quite as low as last July) and relatively steady. The signs are > good. The New York Times (as of 2/13/22) shows new cases in Chester County > averaging 35 new cases daily per 100,000 reside” >
LikeLike