
The last time I wrote about the local Covid trend was about two months ago. The headline was “Chester County is finally at ‘Low’ Covid risk level.” With the recent clusters of cases at Kendal, Crosslands, and Cartmel, (and with some other potentially troubling signs) it seems like an appropriate time for an update.
Climbing, but still low. The trends are very uncertain right now. Nationally, Covid infections are climbing, but from a very low base in most places. For the country as a whole, new infections were up 52% over the last two weeks. For Chester County, the figure was 43%. (This is information from the New York Times, as of April 30.) Those are big growth rates.
But even so, the daily rate of new cases per 100,000 people (which is the most important figure, in my opinion) is still very low—17 for the US, and 17 for Chester County as well. For Pennsylvania as a whole, it is 14. When you consider that the Chester County rate got very close to 1,000 cases per 100,000 at one point during Omicron last winter, you can see why I call 15 per 100,000 “very low”.
The latest New York Times chart also seems to suggest that the rate of new cases in Chester County is still rising slightly.

The weekly data from the Chester County Health Department is still showing “Low” risk. Oddly, the County is reporting a rate per 100,000 of 115.05, far higher than the New York Times figure. The Chester County rate comes from the CDC website. I can’t explain that discrepancy.
Are cases being missed? It is also important to remember that most official case counts are based on PCR tests. But with free antigen tests being widely distributed these days, many people may be testing themselves at home. Even if they test positive, if their symptoms are mild, they may not seek medical treatment and their cases may not make it into the official count. So although the counts reported above are generally good sources for trend information, they can’t necessarily be trusted to offer an accurate comparison with previous periods or other countries.
In any case, those figures represent the best information we have on where things stand right now. If we accept the limitations of the data, our rates are very low compared with past spikes. However, that information doesn’t help us see what might be coming. But there may be other ways to get a hint of what might happen next.
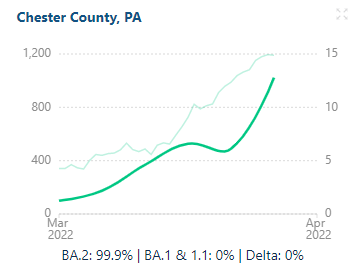
What the sewage is saying. One way to get a hint of the what lies ahead is sewage monitoring. The level of Covid virus shows up in sewage a week or two before the positive test results starts climbing in the case data. You can get county-level data from Biobot, the leader in wastewater Covid testing, here. The Biobot data shows that virus levels in Chester County have been climbing steeply since early March.
Biobot reports its data in terms of “effective viral copies per ml of wastewater”. It is not important to understand what that means; the important part is the trend. And the trend is dramatically upward. On March 2, the value was at its low point so far this year: 59 copies/ml. The most recent value (April 20) was 1,022 copies/ml. That’s 17 times higher, and suggests we may see a substantial increase in reported Covid cases soon.
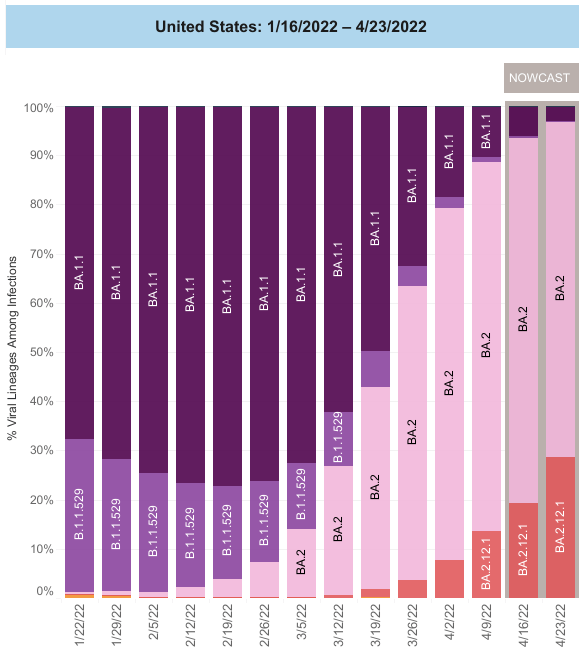
The new variants. The original Omicron variant, known as BA.1, that caused the Omicron spike in Covid cases is now rare in most areas. It has been displaced by two other variants, BA.2 and BA.2.12.1. Each of these is more transmissible than the previous one, and it looks as if B.2.12.1 is likely to take over as the dominant variant in the US. The chart below is US data from the CDC, showing the percentage of each variant, week by week. As you can see, the BA.2 variant (pink) accounts for about 2/3 of cases, but BA2.12.1 (orange) is catching up rapidly. The earlier Omicron variants account for only about 3% of cases.
The reports so far indicate that the symptoms associated with the new variants are, on average, no worse than they were for earlier versions of Omicron. And the vaccines seem to be just as effective. So the most worrisome thing about these variants is their transmissibility.
The increased transmissibility means that we are probably in for more rapid growth in cases, especially among the unvaccinated. The sewage data suggests that accelerated growth is already starting—but it hasn’t really showed up in the reported cases yet.
How serious is this uptick? It’s hard to say whether these issues might indicate a serious problem in the offing. Suppose we assume the worst: that BA.2.12.1 really is much more contagious than previous variants, and cases start to rise rapidly. That may not be too much of a problem for vaccinated people, as long as the vaccines continue to work well against BA.2.12.1 (which, so far, they seem to do). So far, in most places, hospitalizations due to Omicron have been far lower than those due to earlier variants; and in general, the symptoms of Omicron have been milder.
Still, in a few states hospitalizations are starting to rise rapidly. Vermont (which is the state which currently has the highest Covid case rate (about 3X the Pennsylvania rate) has seen its Covid hospitalization rate triple in April, approaching the highest levels the state has experienced at any time during the pandemic. It’s also true, however, that Vermont managed to avoid the worst of both the initial Covid spike and the Delta spike. It wasn’t until Omicron that the state really got hit hard. So it may be that Vermont’s exceptional pandemic history means that its current hospitalization trend is also exceptional and won’t happen elsewhere.
Still, it is wise to be cautious and wait to see how our local situation plays out. We seem to be in good shape right now, but we’ll know better where we stand in another week or two.
