
More than a year ago, Roy Manno (Facilities Director) worked with Joe Deckman (in his previous role as Construction Manager) in quietly starting an interesting experiment. The question was whether modest sustainability improvements in our cottages could impact electrical usage.
At the time, two one-bedroom-with-den cottages with identical layouts were entering the turnover process. With occasional exceptions, our turnovers involve mostly cosmetic upgrades, with only minor changes to improve efficiency. In this experiment, one of the cottages got a modest investment in additional efficiency (we’ll call this the “test” cottage), and the other got the standard treatment (the “control” cottage). Importantly, electrical monitoring gear was added to the breaker box in each unit so that a detailed record of the use of electricity could be kept.
A full year of data has now been collected, and I have been able to take a close look at how the two cottages performed. I won’t identify the cottages or their occupants.
Both of the cottages have single residents. They received identical heat pumps for heating and cooling, and they also received good double-pane windows (this is typical for turnovers).
Special treatment for the test cottage. But the test cottage got two additional treatments. The amount of attic insulation was greatly increased (to a value of R-50, which is several times the typical insulation in our cottages). And work was done to improve the air sealing at the base of the exterior walls. Our cottages are built on cement slabs, and in their original construction (50 years ago), the contact point between the slab and the walls was not sealed. Over the years, that unsealed area has developed into a source of air leakage in many cottages, allowing warm air to leak out in the winter, and warm air to leak in in the summer. To seal that area in the test cottage, the interior drywall was removed along the foot of the wall, sealing was done, and the drywall was replaced.
The cost of these two additional treatments in the test cottage was $3050 ($1800 for sealing and drywall, and $1250 for blow-in insulation in the attic).
Recording of the electricity usage was begun in one of the cottages in late 2022 and in the other in February of 2023. We now have a year’s data available for analysis. In cooperation with Lindsay Eidson in the Facilities Department (Joe Deckman’s new successor as Construction Manager), I have gotten the data and begun an analysis.
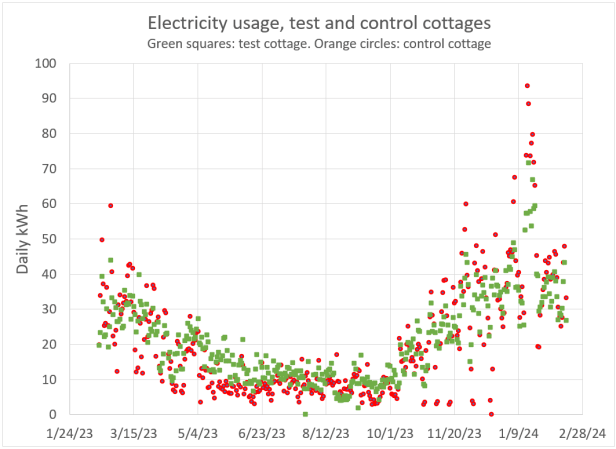
The first insight: modest summer usage. It is common knowledge that Kendal’s electrical usage peaks in the winter. Our use of electrical heating in our cottages causes that. In most of the US, electrical usage peaks in the summer, because of air conditioning demand, while all-electric heating is still uncommon in most areas. I assumed I would see a two-peak pattern in the data, with summer and winter peaks (and that is the pattern with Kendal’s overall electricity use). But I was astonished to find that the two cottages in this experiment show only very modest summer peaks. (I will dig deeper into the summer trends in a future blog post.) Both cottages have huge winter peaks, however.
You can see this in the chart below. Each dot represents a day’s use of energy, with the square green dots representing the test cottage and the round orange dots representing the control cottage. The chart runs from February 2023 on the left to February 2024 on the right. The huge jump in electricity usage shown at the right represents the cold-weather period of November 2023 through February 2024. By contrast, there is only modest variability during the summer months (middle portion of the chart).
Note that this chart is just showing total electricity used each day. There can be big differences in the time of day when the electricity is used. Those don’t show up here.
The second insight: the test cottage’s winter performance. Looking at the winter peak, the difference between the two cottages is dramatic. The highest part of the peak consists mostly of orange dots (the control cottage). There is a huge difference in use of electricity between the cottages during the coldest weather.
I believe the difference would have been even greater if not for the fact that the resident in the control cottage made several out-of-state trips during November and December, leaving the cottage at a low temperature setting. These periods of low use by the control cottage can be seen as orange dots near the bottom of the chart in the November-December period.
What this analysis shows is that the relatively modest changes made to the test cottage had a dramatic impact on its winter heating performance.
There is a lot of additional information that can be gleaned from the electrical data, and I will be reporting on that in the near future.

Some real data! Even though a limited sample, it is very suggestive of an improvement that could keep residents warmer and energy use reduced. Nide work
LikeLike
Thanks, George. This was very informative! Did the peop
LikeLike
This is actually from Harry Hammond. For some reason, it didn’t stick when he posted it.
—
In addition to what the results point to (energy savings, lowered costs, improved resident comfort), the experiment illustrates that collaboration is itself valuable. Residents who want their committees to work more effectively with staff should ask George about the discussions, goals, and proposals that advanced the project.
A clear strength about the project was that it had the advantage of being science-based. It was framed as testable; financially doable; and highly actionable. During recent years, nearly every vacated cottage is routinely improved in a variety of other ways before new residents move in, and a line for doing so already exists in the maintenance department’s yearly budget. If the now demonstrated benefits of added insulation, etc. is adopted for future cottage turnovers, there’ll be long-term financial benefit to KCC. Additionally, more energy-efficient cottages will improve KCC’s stewardship of resources and KCC’s reputation.
Another thing I notice is that the experiment squarely addressed one of Kendal’s long-standing goals. The2006–2011 Long Range Plan expressed that goal (one of 9) as, “Provide conscientious and environmentally responsible stewardship of our resources, being aware of the impact of our decisions on the environment.” In the current 2021–2024 Plan, that section (one of 13) is titled, more vaguely, “Our commitments to Environmental Stewardship.” Aligning one’s project with KCC’s stated goals is also a best practice for committees.
This first report on the Energy Committee’s experiment is also serendipitously timely. KCC’s “2021 Revitalization Plan,” which focused on housing stock, recommended replacing Kendal at Longwood’s 50-year-old clustered cottages with new clusters “on similar footprints.” The results of the two-cottages experiment will someday inform the KCC Board’s future decisions on what to do with Kendal’s oldest housing, some of which, due to inadequate foundations and erosion from earlier storm water issues, are probably past their use-by date. But some of those older cottage clusters might be worth saving. If so, the best of them could be more thoroughly updated, with additional energy savings in mind, during turnovers. On the other hand, if the cluster-replacement option replacement proves unaffordable, in light of the increase in debt that comes with expanding the Kendal Health Center, revitalizing existing cottages could benefit from this experiment.
I hope the committee will publish its future findings, as the two cottages cycle through additional cooling and heating seasons.
LikeLike