
A California company named Kinsa makes thermometers that communicate with your iPhone or Android smart phone. The phone app not only shows you your temperature, but also provides a record of past temperature readings, provides basic medical advice, tells you what illnesses are going around in your area, and lets you track your meds.
As it happens, some information about the Covid-19 outbreak has surfaced as a byproduct of Kinsa’s thermometers. That’s because the company also aggregates the smart-phone temperature data from all its users, anonymously, over the web. The data allows them to have a picture of the rise and fall of illnesses, especially the flu, among their 1.3 million thermometer users. Kinsa can observe whether “influenza-like illness” (ILI) is rising or falling anywhere in the US. In many places (including most of Pennsylvania) they have enough users to track ILI on a county-by-county basis.
Over the last few years, Kinsa’s data has proven to be an accurate indication of where ILI outbreaks (mostly routine seasonal flu) are occurring. Because the data is available within 24 hours, it comes much sooner than the normal reporting from the CDC or local health agencies (which has a lag of about 2-3 weeks).
This year, the thermometer data is also helping to track Covid-19. Covid-19 is an ILI, with symptoms similar to seasonal flu, so it is included as part of Kinsa’s data. You can watch the Kinsa data, day by day, on the company’s website, and there is some interesting and unexpected insight to be gleaned.
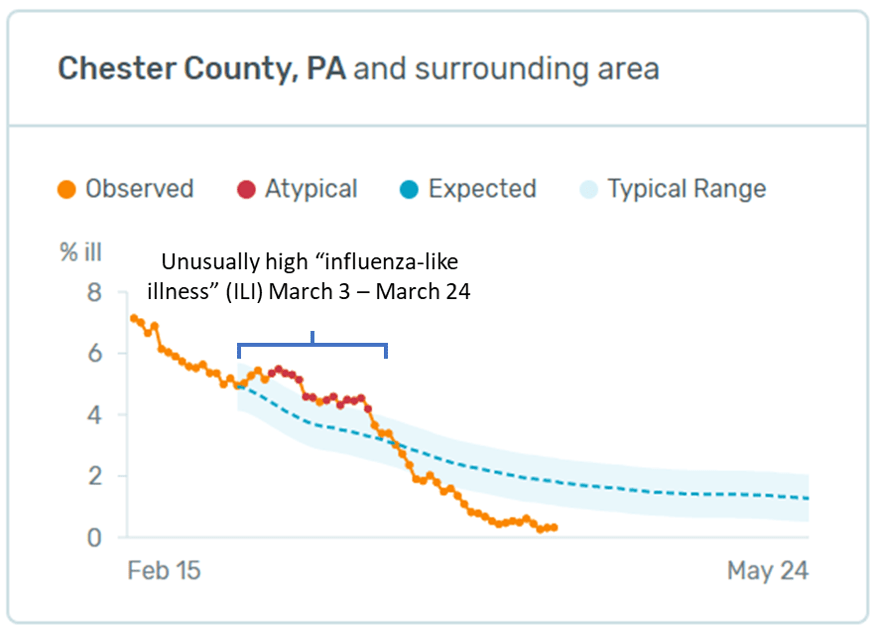
In March, Chester County had more flu-like illness than usual. In April, it has less than usual. The Kinsa data shows that ILI (flu-like illness) in Chester County is currently unusually low for this time in April. (The chart above is from the Kinsa website, with my annotations.) The data shows that between March 3 and March 24, ILI was higher than expected; and at the peak, between March 7 and March 21, the amount of ILI was “atypical” (outside the normal range). But then it dropped rapidly and by March 28 it was below the typical range for this time of year. Yet reported Covid-19 cases were increasing in the county throughout the mid-March to mid-April period.
How could the ILI symptoms from Kinsa’s thermometers be going down while Covid-19 statistics are going up? There are two answers, one about the statistics and the other about illness patterns under “social distancing”.
First, the official Covid-19 statistics are based on testing, mostly done in hospitals and then reported to county health authorities, who then report to the state. That all takes time, so infections that happened three weeks ago are still showing up in the stats. Many of the patients whose symptoms showed up in Kinsa’s March data are presumably just appearing in the official case statistics now.
The other part of the answer is a result of social distancing. Not only has social distancing slowed the spread of Covid-19, it has also slowed the spread of seasonal flu. And seasonal flu, although it is less serious, affects far more people than Covid-19. So the dramatic drop in ordinary flu cases has overwhelmed the slower increase in Covid-19 in Kinsa’s data, which is based on symptoms that are common to both. The low ILI numbers we are seeing now from Kinsa are from a combination of reduced seasonal flu and reduced Covid-19.
As the Kinsa website puts it, “Social distancing has caused incidence of flu-like illness to drop nationwide. We believe confirmed COVID-19 cases will continue to increase in the near term as testing becomes more widespread, even though overall population percent ILI has decreased nationwide.” It seems the measures we are taking to stop the spread of Covid-19 have also stopped the spread of the flu.
Note that the chart title says “Chester County, PA and surrounding area”. On their FAQ page, Kinsa says: “…residents of nearby counties regularly mix and share illness exposures. We also factor in information from neighboring counties in our estimate of illness levels…. It’s probably best to think of our illness signal as representing a geographic area centered around a particular county, rather than a single county exclusively.” But the Kinsa data probably provides a good indication of what’s happening here.
It remains to be seen whether Covid-19 will show the same seasonal decline as garden-variety seasonal flu. If it does not, then perhaps Kinsa’s data for the coming summer will be mostly a reflection of Covid-19, with very little seasonal flu mixed in.
