
On the whole, Chester County has done a good job of keeping the pandemic under control. There have been a handful of serious nursing-home outbreaks, but relatively few cases among the general public—especially in comparison with some of our neighboring counties.
But case counts have been rising statewide in the wake of the move to “Green” status. New cases are climbing in Chester County, though not at the rate they are in some other parts of the state. Here is a graph of how cases have been trending in Chester County.

This chart is from data I downloaded from the county-level database maintained by the New York Times. The chart shows that the downward trend in new cases has been reversed and, in the wake of Chester County moving into the Green phase of reopening on June 26, cases are now increasing. The number of new cases is approaching the peak levels of May and June. Will it get worse?
Thermometer data points toward a Pennsylvania surge. At the state level, it may well get worse. That, at least, is the implication of reporting by Kinsa, maker of internet-connected thermometers.
I wrote previously about Kinsa’s network of thermometers. It allows the company to collect and publish aggregated, anonymous data about symptoms of its thermometer users. When I wrote that earlier post, Kinsa was reporting daily “influenza-like illness” (ILI) prevalence at the county level for most of the country. By itself, that was a great service, because the reports were available a few days earlier than the official state and national reports, giving health officials a heads-up on potential outbreaks.
Now, Kinsa has taken this a step further. By comparing day-to-day changes in the prevalence of ILI in a given county, Kinsa can estimate “Rt”, the local illness transmission rate. Rt is a measure of how many new infections are caused by one current infection. When Rt is greater than 1, illness is spreading; when it is less than 1, it is fizzling out. If a region has several weeks of Rt greater than 1 (even if only slightly greater than 1; e.g. 1.05), that is a danger signal that control of the spread may have been lost and significant growth in cases may lie ahead. The maps at Kinsa’s website depict Rt at the county level across the US.
The calculation of Rt is helpful because it can provide a warning of an impending outbreak long before the official cases reflect it. The company claims it is a “3-week leading indicator” of Covid-19 outbreaks.
Using this metric, Kinsa is forecasting significant outbreaks in Pennsylvania and Michigan. The high Rt values that Kinsa reports for Pennsylvania are primarily in the western part of the state. In Allegheny County (Pittsburgh and environs) Rt peaked at over 1.1 early in July, and although it has declined, it still remains above 1 now.
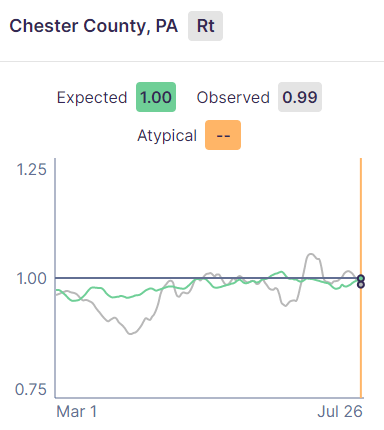
We may be OK in Chester County. Chester County experienced a peak Rt of around 1.04 at the beginning of July, but the county Rt value has hovered around 1.0 since then and is at 0.99 as of July 26. That suggests that the current case growth that the county has been experiencing will level out.
Delaware County, our neighbor to the east, has been above 1.0 for several weeks and is experiencing serious growth in cases, although not quite to the catastrophic levels it had last April. The Kinsa data shows that Delaware County’s Rt has now dropped back to 1.0, so that suggests the growth phase may be ending.
However, Pittsburgh-area counties—Allegheny, Beaver, Washington, and some others—continue to have Rt values above 1, suggesting that things in western Pennsylvania could get worse before they get better.
Similarly, many counties in western Michigan are showing sustained levels of Rt higher than 1, signaling possible trouble there.
Neither Pennsylvania nor Michigan is currently prominent on “pandemic hotspot” maps, such as the one published daily by the New York Times. If Kinsa’s Rt calculations have the predictive value that the company claims, those maps will soon reflect it.
What about the states with current outbreaks? My reading of the Kinsa data suggests that states like Texas and Florida, the focus of much media attention right now, may be making progress in controlling the pandemic. Their Rt values have dropped to levels around 1.0. But there may be more trouble ahead for Arizona and Georgia, where Rt has recently been spiking, suggesting more growth in cases on top of the serious outbreaks they are already experiencing.
Ultimately, ending the pandemic will require prolonged periods with Rt below 1. A vaccine will probably be needed to achieve that. In the meantime, masks and social distancing measures will continue to be needed to keep Rt from climbing.
