
This is the second blog post based on an analysis of voter registration data for Kendal. In the first blog post on this topic, I described the high frequency of voter registration at Kendal, the age structure of our voting population, the overall Democratic lean, and the year-of-arrival data. This time, I will dig a bit deeper into the details about specific sub-groups.
Couples vs. singles. I was interested in whether the voting registration of couples differed from those of single residents. An obvious case to look at is studio apartments, which have exclusively single residents. There are 22 of them in the voting data; and interestingly, every studio resident is registered as a Democrat.
Among the non-studio residents, about half of us live alone and about half live as couples. Of those who live alone, the registration split is 76% Democrat, 15% Republican, and 9% other. For those living in couples, the figures are almost identical: 78%, 14%, and 8%.
Of the 91 couples in the data, the vast majority shared the same registration. There were only 10 couples where one partner was registered as a Republican and the other as a Democrat. Interestingly, among split-registered mixed-gender couples, it was the man who was the Republican in 9 of the 10 cases.
The new-cottage cohort. The new duplex cottages (numbers 249-299) were opened for occupancy in 2012. For the most part, the original occupants are still living there.
The residents in these cottages have slightly different attributes from the rest of our population. Of the 82 registered voters currently listing those cottages as their address, only 8 have moved in since 2013. The means over 90% have been there for at least 8 years. As a result, the typical resident in those cottages is older than is the case for Kendal as a whole. As the chart below shows, there are far more residents in their 70s in the traditional cottages than in the new ones. Most new-cottage residents are in their 80s.
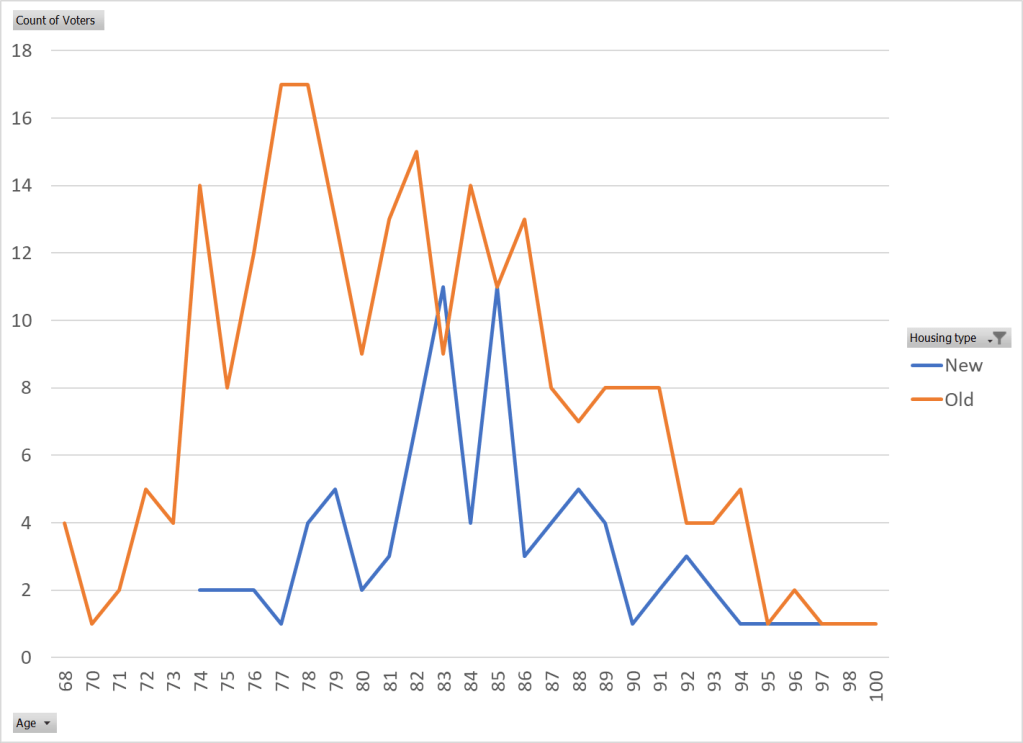
Not only are the new-cottage residents older on average, they are also more Republican. Among those living in the traditional cottages, Democrats outnumber Republicans by more than 10 to 1. In the new duplexes, Democrats still predominate, but the ratio is only about 3 to 1.
You might imagine that this trend toward more Republicans among the new-cottage population is simply because it is an older population, and older people trend more Republican. But if that were so, the trend would show up in the traditional-cottage population too, and it doesn’t: among traditional-cottage dwellers, the percentage of Republicans actually peaks among 75-80-year-olds and then it declines with age.
Cumberland and Westmoreland voters. I found it interesting to look at the details of the 69 voters with Cumberland (personal care) and Westmoreland (skilled nursing) addresses. The registration data shows 69 registered voters (47 in Cumberland, 22 in Westmoreland). Democrats outnumber Republicans 4-1 in Cumberland and 3-1 in Westmoreland.
The age of our Cumberland voter residents (blue bars in chart below) ranges from 76 to 102, with a peak around 90. Westmoreland residents are generally a bit older (red bars).
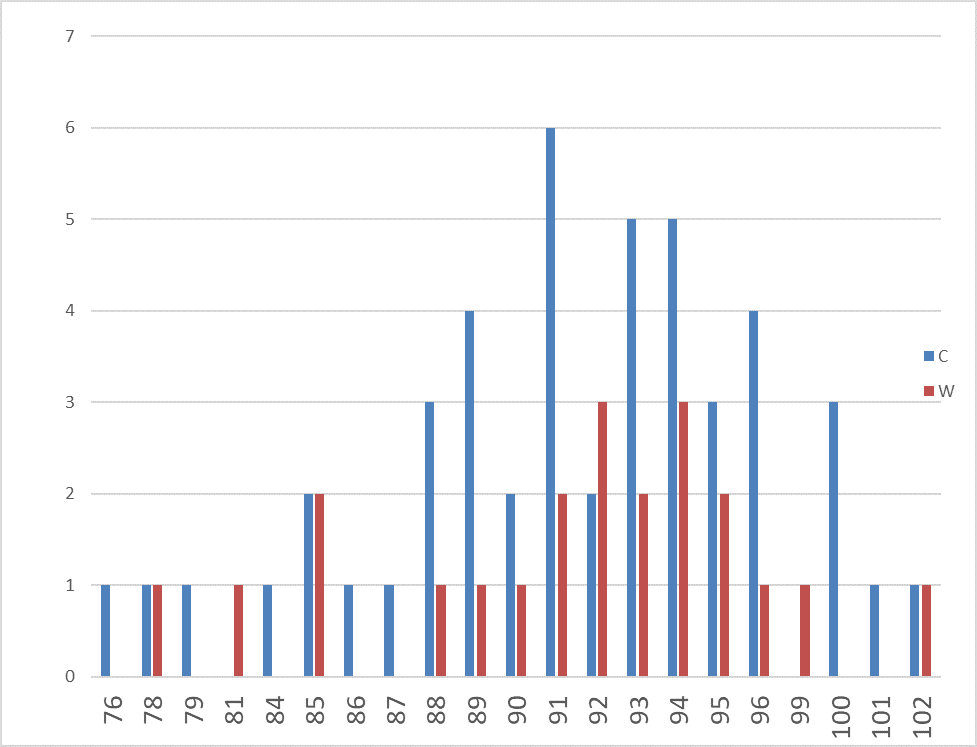
41 of the 47 registered voters in Cumberland and 18 of the 22 in Westmoreland voted in 2020.
In these two posts, I have attempted to present some of the more interesting findings in my analysis of the voter data. There are, however, limitations in the data that prevent answering some questions I’m curious about. Because the data is a snapshot of current registered voters, it can’t tell us much about past residents. For example, I wonder if our average age at arrival has been going up or down. You can’t answer that if you only have data on current residents, because the data on deceased residents from previous arrival years is not included. And, of course, those who are not registered to vote aren’t included. Still, I hope you agree that the data does provide some interesting insights.

Great George. Thank you.
On Wed, May 19, 2021 at 9:56 AM On the Kendal Journey wrote:
> galex49 posted: ” This is the second blog post based on an analysis of > voter registration data for Kendal. In the first blog post on this topic, I > described the high frequency of voter registration at Kendal, the age > structure of our voting population, the overall Democra” >
LikeLike
George: Your data are fascinating and will serve as a useful baseline for examining how things change in the future, esp. with the revitalization effort and the hoped-for emphasis on attracting a more diverse resident population. Keep up the good work.
LikeLike
Thanks, BJ & Ernie. I’m glad you found it interesting.
LikeLike
I’m a bit slow in reading this, but it is very interesting. Of course, data can be deceptive. In our two-party marriage, Bob is Republican in order to vote in the primaries against those affiliated with Trumpism, but is a reliable Democrat otherwise.
LikeLike