
My recent analyses of the voter rolls at Kendal (here and here) led me to wonder what differences there might be between voters at Kendal and at other CCRCs. As most readers probably know, CCRCs (Continuing Care Retirement Communities, now being rebranded as “Life Plan” communities) offer independent living, assisted living, and nursing care for a single monthly fee. Kendal is a member of a local group (the CCRC Area Council) that includes 13 other CCRCs in the Philadelphia area.
I decided to take a look at the data for the other members of the Area Council to see how similar they were. The Area Council members are:
- Beaumont
- Cathedral Village
- Crosslands
- Dunwoody
- Freedom Village
- Granite Farms
- The Hill at Whitemarsh
- Kendal
- Lima Estates
- The Quadrangle
- Riddle Village
- Waverly Heights
- Wesley Enhanced Living (formerly Martin’s Run)
- White Horse Village
In addition, I included Maris Grove, a nearby large CCRC that is not an Area Council member, because many Kendal residents seem to be familiar with it.
The CCRCs are spread across four counties: Chester, Delaware, Montgomery, and Philadelphia. The voter registration files are by county, so I had to deal with four data files, each with hundreds of thousands of voter records.
I ended up dropping Cathedral Village from the analysis because it is in Philadelphia County. The Philadelphia file has over 1,120,000 records, and my copy of Excel (which I used for the initial data extraction) will only handle 1,048,576 records. (I considered other tools I could have used to deal with the Philadelphia data, but the project showed signs of becoming an unhealthy obsession, so I didn’t go there.)
Extracting the records. Having done the Kendal analysis, I thought the others would be easier. That didn’t turn out to be the case, primarily because of the difficulty in extracting the records for each CCRC from the voter registration files. In the case of Kendal, all the voter addresses are on “Kendal Drive”—that made it easy. Similarly, Crosslands voters are on “Crosslands Drive”. But voter addresses for other CCRCs were often a hodge-podge of street names internal to the campus. In other cases, the nearby main road was specified, but many non-CCRC residents lived along it too, making the extraction difficult. After many hours, I was able to obtain what I believe to be a “clean” file of all the CCRC residents (and no other voters) for each of the CCRCs.
What is the data like? The files I obtained show only registered voters. I could not do the same analysis as I did for Kendal, because I did not have the equivalent of our “Who’s Here” and our on-line directory. Those resources allowed me to work with move-in dates (to assess duration of residence) and to find unregistered voters (to assess rates of registration). That kind of data, if it were available, would be great to have for the other CCRCs. But I don’t have it.
What I do have is mainly information about age, party registration, and date of most recent vote. That’s enough to make some interesting observations about how the CCRCs differ, and to pose some intriguing questions (for someone else to pursue—I’m done!).
Average age. A good place to start is our age. All the CCRCs have an average age in the mid-80s, but some are notably older or younger. Kendal, with an average age of 84.2, is one of the youngest. The Quadrangle (which, as you’ll see, has similar voting characteristics to Kendal’s) is by far the oldest, at 87.2. Crosslands (85.2) is in the middle. The details are in the chart below.

The data doesn’t provide an explanation of the reasons for the age differences. The decision of when to move could be part of the reason. Some communities might get lots of “late movers”. For example, could it be that people deciding to move to the Quadrangle do so at a later age than Kendal or Beaumont? Could it be that residents of certain communities are more likely to move there because their age-related health conditions mean they just can’t stay where they are? Maybe people who can afford good care while remaining at home might prefer certain communities, but only when their home care is no longer sufficient.
Community growth history could be a factor. Communities that are expanding might skew younger, because move-ins predominate. (That wouldn’t explain Kendal’s relative youth, though.) Communities where the founding generation still predominates might skew older.
I suspect all these factors are involved, to one degree or another.
The details of the age profile for Kendal, Crosslands, and The Quadrangle are shown below. Each has a different age pattern for the resident population. For Kendal, the peak population is 85 and under. For The Quadrangle, the greatest numbers are in their late 80s. And Crosslands has two distinct peaks.
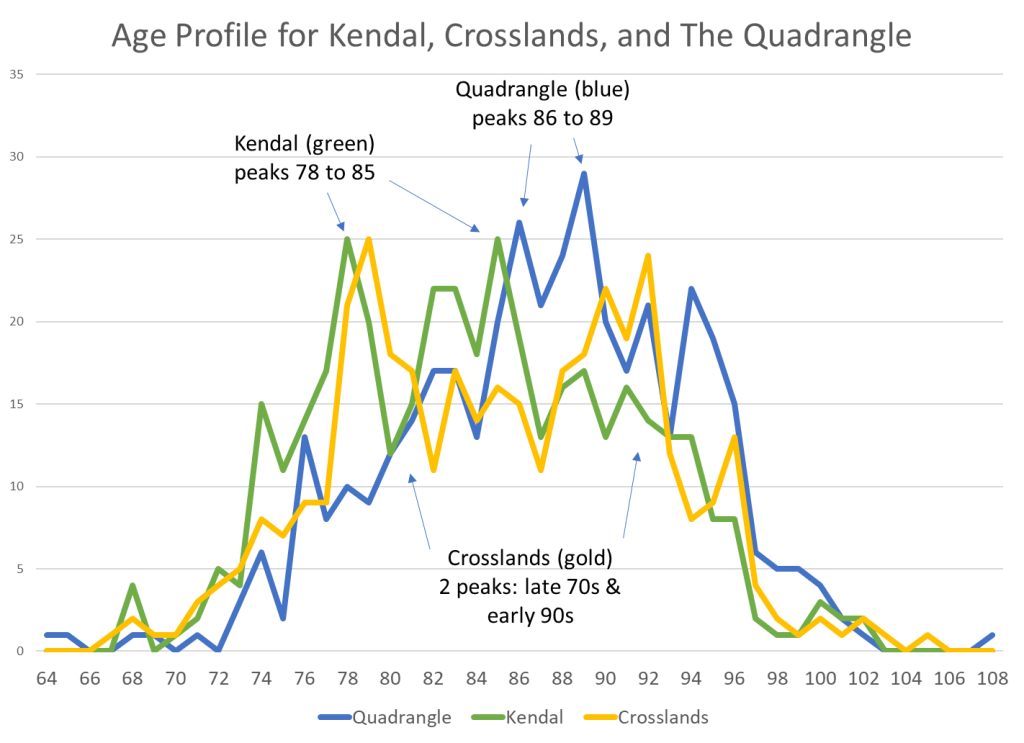
I’m not sure what to make of the “bi-modal” age distribution at Crosslands. Perhaps a reader can help out. Could it be that the older peak (people in their 90s) might be the result of the initial generation of the new-cottage residents, and the younger peak (people in their late 70s) might be the “second generation” moving into those cottages as the older residents age out?
Who votes? The voter-registration data doesn’t show how many residents register to vote, but it does show how many of the ones who are registered actually do vote. That serves as an indicator of how essential voting is thought to be. I did an analysis of what percentage of registered voters actually voted in 2020, in each community.
Kendal led the way in this category, with over 92% of registered voters actually voting. There were four other communities close behind: Waverly Heights, Crosslands, White Horse Village, and Beaumont (in that order) were all above 90%.
Age was also a factor that correlated with voting propensity. The five that had higher than 90% turnout were among the younger communities, on average. An outlier in that respect was Maris Grove. Although it was among the youngest (average age 84.5), only 82% of its registered voters actually did vote.

Which party? There is striking variability in party registration among CCRCs. In the 14 I studied, only four leaned Democratic: The Quadrangle (78%), Kendal (77%), Crosslands (73%), and Wesley Enhanced Living (the former Martin’s Run, 63%). The chart below shows how different those four are from the rest of the sample.

I find it interesting that the CCRC with the oldest population (The Quadrangle) is also the one with the highest proportion of registered Democrats. The Quadrangle was founded in 1986 by a group of retired professors, most of them Quakers. That legacy may help explain its liberal lean.
Those who don’t choose either the Democratic or Republican party. A small but important minority don’t specify either Democratic or Republican when they register. By doing so, they pay a price in Pennsylvania: they can’t vote in primary elections. In some cases, they specify a smaller party, and in others they specify that they have no party preference at all.
The chart below shows that there is quite a range (5% to 12%) in the number of these “other” registrants at the CCRCs in my sample.

It is notable that the top three in this category (Freedom Village, Maris Grove, and Lima Estates) were also the CCRCs with the highest percentage of registered Republicans. In the absence of better data, it is impossible to say why this would be the case. One possibility might be that these CCRCs attract conservatives, but there are subgroups among the conservatives who are not satisfied with the current Republican party (either because it has changed too much under the Trump presidency or because it has not changed enough).
Here is how the party choices broke down among the CCRCs with the highest percentage of not-Democrats-or-Republicans.
- Freedom Village: 53 “independent”, “no affiliation” or “other”.
- Maris Grove: 175 “independent”, “no affiliation” or “other”, 1 Libertarian.
- Lima Estates: 32 “independent”, “no affiliation” or “other”, 1 Green.
- Kendal: 34 “independent”, “no affiliation” or “other”, 1 Libertarian.
- Crosslands: 31 “independent”, “no affiliation” or “other”, 1 Libertarian.
Many people approaching retirement and shopping for a CCRC may have difficulty seeing the differences among them. Often, the CCRCs themselves are not eager to point them out. But as I hope this blog post has shown, there are significant differences, even among members of our Area Council, which is a group of superficially similar communities.

Thanks again, George. The figures do not surprise me, having represented the KRA on the council some years ago and have a good sense of these communities. Stuff changes, of course. Still…I love reading your blog! What a service you offer. bj
On Sun, May 23, 2021 at 12:28 PM On the Kendal Journey wrote:
> galex49 posted: ” My recent analyses of the voter rolls at Kendal (here > and here) led me to wonder what differences there might be between voters > at Kendal and at other CCRCs. As most readers probably know, CCRCs > (Continuing Care Retirement Communities, now being rebrande” >
LikeLike
Thanks, BJ. It’s good to learn that this data is in line with your experience.
— G
LikeLike
Thanks so much, George, for your insightful analysis and the effort you’ve put into identifying relevant source files plus doing the data extraction and “cleaning.” The questions you pose are relevant and help us all to better understand where KCC fits into the larger CCRC / Life Plan community picture on a variety of demographic variables. Great job – and nice vizzes!
LikeLike
Thanks for the kind words, Beth.
LikeLike